
Graph
Plot and examine functions.
Entering functions
- Tap the Function Definer button (f(x)). Ten rows f1(x) to f10(x) appear.
- Enter the functions as they appear in the textbook: with fractions, brackets and powers. Enter moves to the next row.
- Tap Done or Draw.
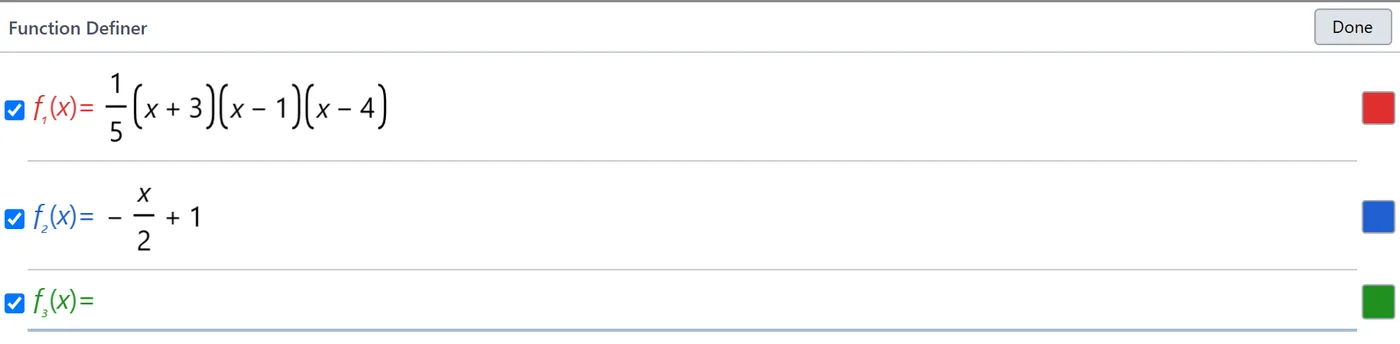
- The tick in front of a row shows or hides the function.
- The colour square at the end of the row changes colour, line style and width.
- A function from Analysis, such as g(x), can be used here directly.
- If a row contains a y, CASDesk draws it as an equation, for example a circle
x² + y² = 25. - Parameters: any other letter without a value becomes a slider, for example a and b in
a·sin(b·x). Tapping the slider's name sets its range. Moving it recalculates the curve and its analyses at once.
View
- ±5 range, ±10, ±100, ±1000 set the x-axis to that range; the y-axis follows.
- Axis Ranges sets x min, x max, y min and y max; expressions such as π are allowed. Tick Distances sets the axis scale.
- Box zoom: tap the button, then drag a rectangle around the part you want to see. Grid Settings shows a grid and sets it up.
- Zoom in and Zoom out zoom about the centre. The mouse wheel or two fingers zoom at a particular spot; dragging moves the picture.
- Tapping an axis arrowhead holds that axis while zooming and moving. A second tap releases it.
Examining functions
The mode buttons on the left examine the functions drawn:
| Button | Result |
|---|---|
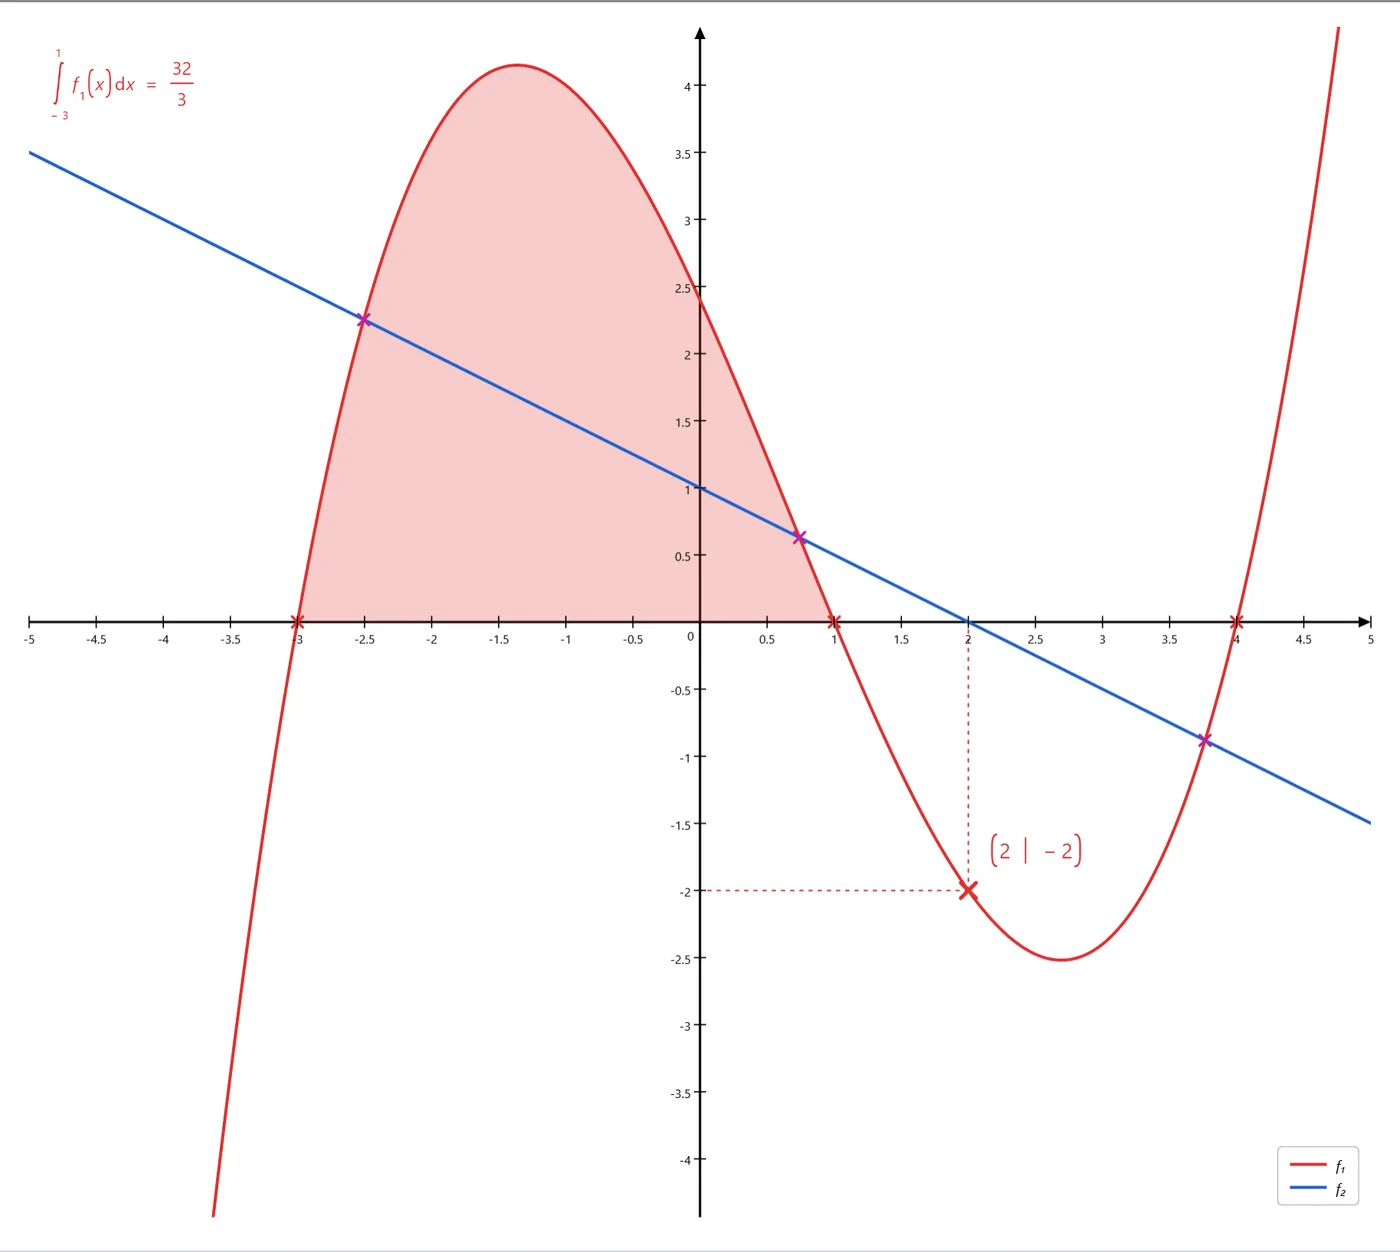
| Roots (zeros) | all zeros in the visible range |
| Local minimum, Local maximum | low and high points |
| Inflection points | inflection points |
| y-intercept | where the graph meets the y-axis |
| Intersections | intersections of two functions |
| y-Calculator | the value f(x) for an x you enter |
| x-Calculator | every x in the visible range where f(x) takes a value you enter |
- Which function? If you tap a curve first, it is selected and examined at once. Otherwise CASDesk asks which function you mean.
- Visible range: the search covers the part currently on screen. To find more, move the picture and tap the button again.
- Results appear as crosses on the curve. The selected point shows its coordinates, such as (2 | −2), with dashed lines to the axes. The arrow keys ← → step from point to point.
- Exact or decimal: with Fraction, CASDesk shows coordinates exactly where it can, for example √2.
- Removing: tapping the selected point again removes that whole analysis. Edit → Clear All removes all analyses; the functions stay.
Definite integral
- Tap Definite Integral.
- Enter the bounds a and b. If you have found zeros or intersections first, tapping their crosses fills the bounds one after the other.
- Confirm with OK. The area is shaded in the function's colour, and the value appears at the top left, for example ∫ = 32/3.
- area between gives the area between two functions.
- |∫| counts areas below the x-axis as positive.
- + additional integral adds up to six sections, for example from zero to zero.
- Tapping a shaded area removes that integral.
Table of values
The Table button shows a table of values for all visible functions. Set x start, x end and step and tap Compute. Draw goes back to the graph.
Measured data and regression
- Data Entry: enter the x and y values in the two rows; the table grows by itself. OK shows the points on the graph. Points from the spreadsheet come over with Plot in Graph mode (see Spreadsheet).
- Regression Fit: choose the data series and the type, for example linear, quadratic, exponential, power, logarithmic, sinusoidal or logistic, and tap Compute Fit. You get the equation and the coefficient of determination R².
- Store keeps the fitted function under a name and draws it as a function.
Taking the graph to the notebook
Edit → Diagram to the notebook puts the graph, with all its points and areas, into the notebook as a card. The same menu exports or copies it as an image.