
Spreadsheet
Record, analyse and chart data.
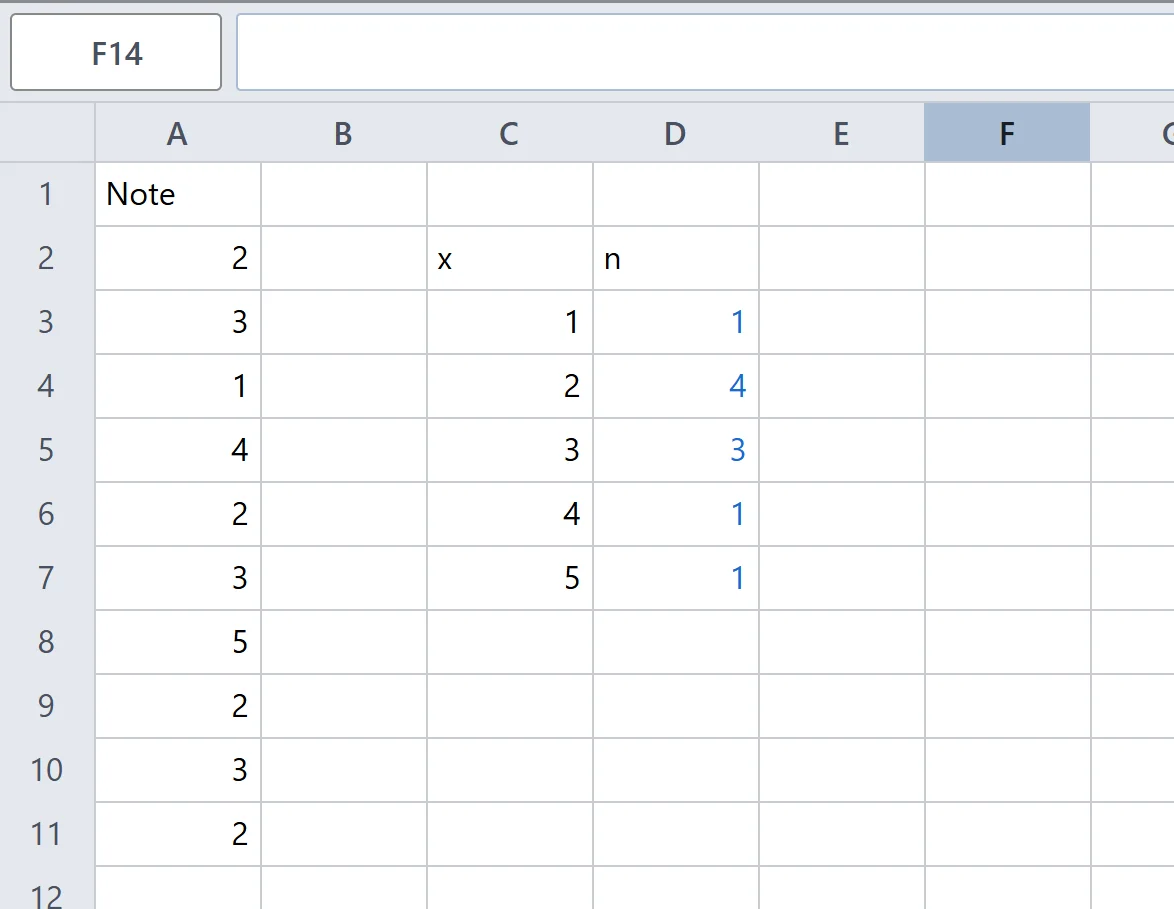
Entering values and formulas
- Tap a cell and type. The entry appears in the bar above the grid, with the same formula display as in Analysis. Enter stores it and moves down a cell, Tab moves right.
- Formulas are written without an equals sign:
2+3gives 5,A2*2doubles the value in A2. CASDesk recognises text such as a heading by itself. - References: a capital letter with a number names a cell, such as
A1; a range is written with a colon, such asA2:A11. While writing a formula you can also simply tap the cell or drag across a range. - Fixed references: the Hold the column and Hold the row buttons turn A1 into $A1 or A$1.
- Filling: the small square at the corner of the selection copies a formula into the neighbouring cells; the references move along.
- Editing: double-click or long-press a cell.
- If you are used to Excel, switch Preferences → Table to Excel-style: formulas start with =.
Selecting several cells shows their count, sum and mean in the line below the grid.
Functions
The Functions button (fx) opens an overview of all spreadsheet functions with a description and an example. + inserts a function. Typing a capital letter makes CASDesk suggest matching functions. The main ones:
| Group | Functions |
|---|---|
| Over a range | SUM, MEAN, COUNT, MIN, MAX, SPAN (range), MEDIAN, QUARTILE, MODE, VAR (variance s²), SD (standard deviation s), PRODUCT |
| Conditional | COUNTIF, SUMIF, MEANIF, COUNTBETWEEN, SUMBETWEEN |
| Distributions | BINOMPDF, BINOMCDF, NORMCDF |
| Random draws | RAND, RANDINT, RANDBINOM, RANDNORM and more |
| Numbers | ROUND, INT, MOD, GCD, LCM and more |
Conditions are written as comparisons, for example COUNTIF(A2:A11, >3). Random numbers are drawn once; Recalculate random cells draws new ones.
Analysis at the press of a button
Select a data column and tap one of these buttons. CASDesk writes the result as formulas next to or below the data, so it keeps up when the data change. Before anything would be overwritten, CASDesk stops and says so.
- Frequency table: one row per value, or classes of equal width.
- Statistics summary: count n, sum, mean x̄, standard deviation s, minimum, maximum, range and median.
Further buttons create data: Fill with a sequence (start, step, count), Simulate data (random values from a distribution) and Probability table. There are also sorting, inserting or deleting rows and columns, and Show formulas.
Charts
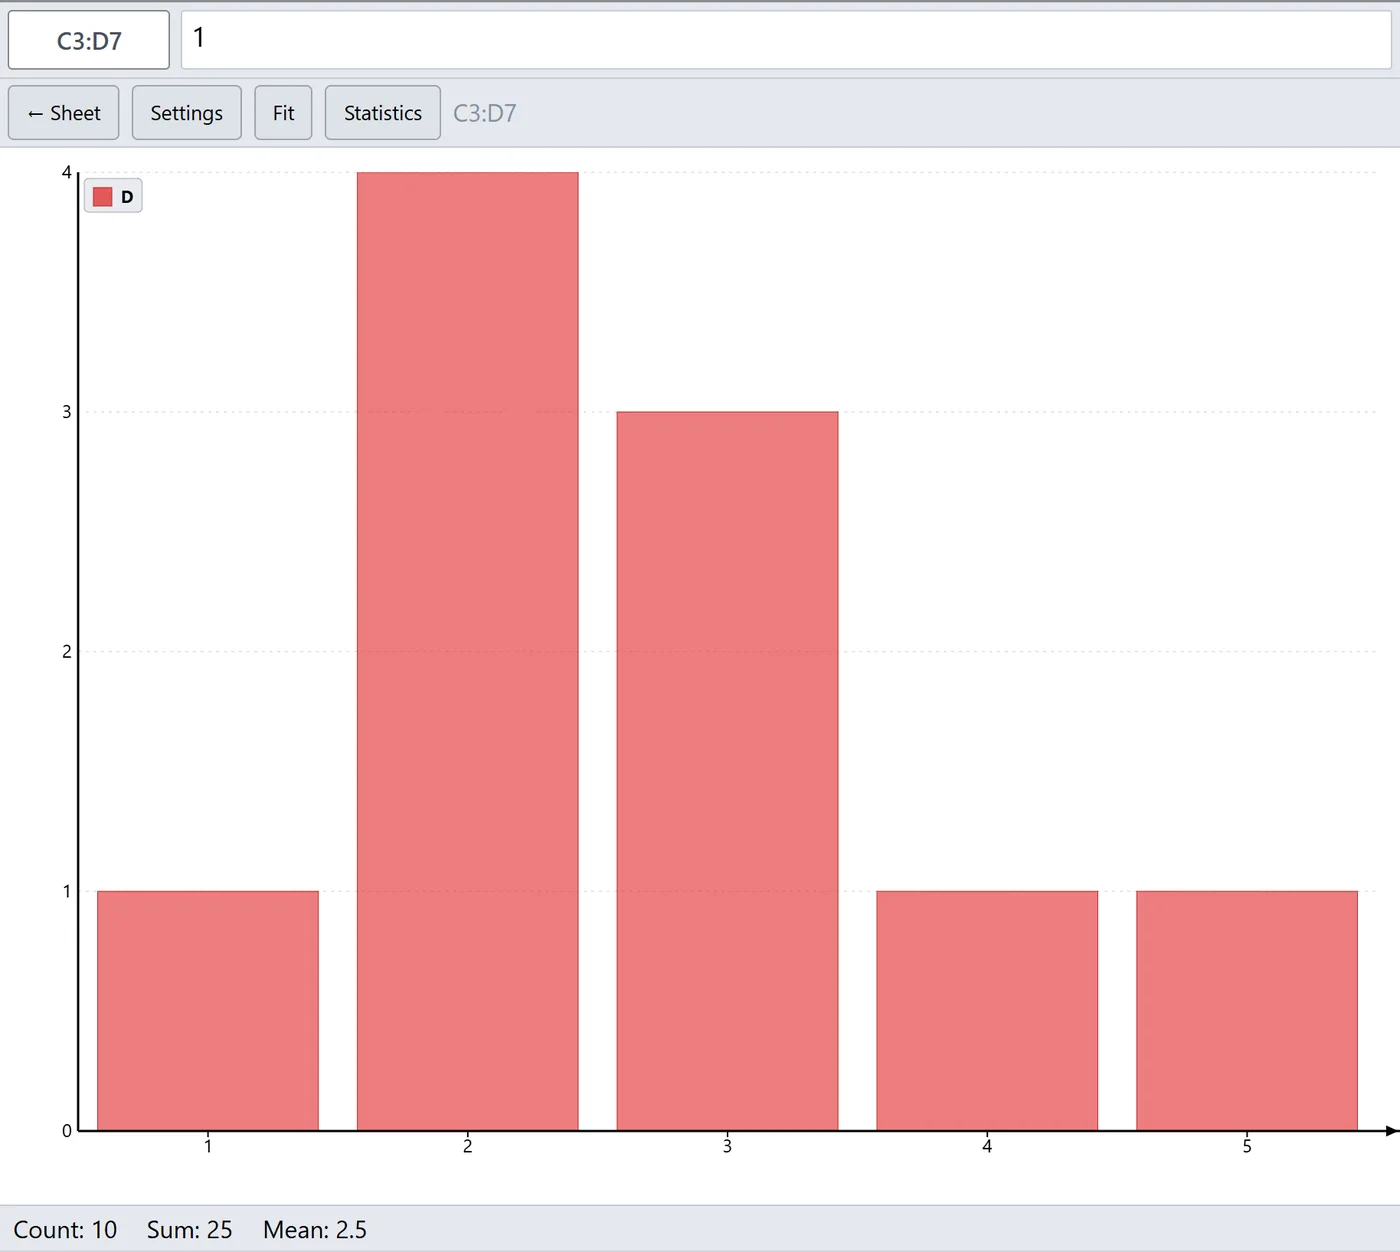
- Select the data; for a column chart, first the column of x values, then one or more columns of heights.
- Tap Chart and choose Column chart, Histogram, Box plot or Normal plot.
- Above the chart, Settings chooses the columns or the classes. Statistics shows mean and standard deviation and can draw µ and ±σ. ← Sheet goes back; the chart is kept under Saved charts.
To the graph and the notebook
- Plot in Graph mode: select two or more columns, x values first. The points appear in Graph, where you can compute a regression.
- Edit → Table to the notebook puts the selected cells with their values into the notebook, Diagram to the notebook the chart on screen.